graphic organizer
Graphic organizers help students to illustrate and connect their understanding of a concept in a text. They are useful educational tools in any subject area. Organizers help students display their thoughts and ideas for answering questions, function as a pre-writing tool for essays, and provide a visual display of information. They can also be an easy way to differentiate instruction for a variety of learning styles. There are different types of names for organizers, such as maps, webs, graphs, charts, frames, or clusters. Each organizer can help students while reading to focus on concepts and how they are related to other concepts to build comprehension. Graphic organizers can also be helpful for students to write a well-organized summary of the text to help the teacher check for understanding (Reading Rockets, 2014).
Some Examples of Graphic Organizers:
|
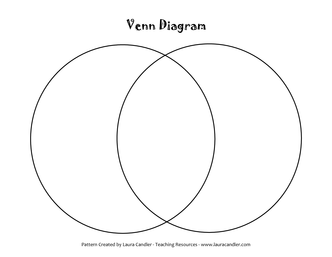
Venn-Diagrams: Can be used to compare or contrast information. |
|
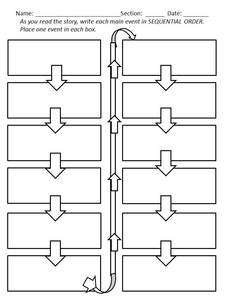
Storyboard/Chain of Events: Can be used to order or sequence events within a text. |
|
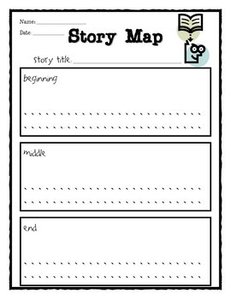
Story Map: Can be used to chart the story structure of fiction and nonfiction texts. |
|
Cause/Effect: Can be used to illustrate the cause and effects within a text. |
Uses in classroom
A teacher could start a lesson by modeling how to use a chain of event graphic organizer with a text. Then, have the students read a text in pairs and provide the student with their own outline of a chain of events organizer. Having students paired together can allow for collaboration about what important events happened throughout the text and write them in order on the organizer. By providing students with a pre-made graphic organizer, students can concentrate more on the order of events, rather than trying to create an organizer (Moore, D., Moore, S., Cunningham, P., & Cunningham, J., 2011). Once all of the students are finished with the graphic organizer, hold a class discussion to see how each of the student’s graphic organizers may be different and why. This strategy will help student build their comprehension of the text.
Another lesson could be for a teacher to model how to use a story map graphic organizer in order to write a summary about a text. Students could be responsible for reading a text and recording important events that occurred on their organizer. Once student are finished reading and complete their organizer, students could write a summary based off of the events they recorded. Then, students could share their summaries with an elbow partner to see how their summaries are similar or differ. This lesson would not only allow the teacher to see how well each student comprehended the text, but also allow student to build comprehension and their writing skills.
Another lesson could be for a teacher to model how to use a story map graphic organizer in order to write a summary about a text. Students could be responsible for reading a text and recording important events that occurred on their organizer. Once student are finished reading and complete their organizer, students could write a summary based off of the events they recorded. Then, students could share their summaries with an elbow partner to see how their summaries are similar or differ. This lesson would not only allow the teacher to see how well each student comprehended the text, but also allow student to build comprehension and their writing skills.
videos
http://www.theteachertoolkit.com/index.php/tool/graphic-organizers
Catherine Haynes is a teacher from Texas that uses a Venn diagram in her classroom. She starts by engaging the students in how to use the diagram to separate and compare two concepts and then models. Once student understand how to use the organizer, she allows the students time to practice. Venn diagrams are easy for students to organize their thoughts and for Haynes to see if each student understands the information (The Teacher Tool Kit).
https://www.teachingchannel.org/videos/circle-maps-nea
Tita Ugalde is a teacher in California that uses circle maps with her students. She starts the lesson by having a whole-group conversation about what students know about soil. Ugalde creates a visual for students by having a white board to record their thoughts. She places soil in the middle of the board and branches off supporting information about soil. This strategy helps students to become engaged in the topic and it allows Ugalde to assess the information that students understand about soil (Teaching Channel, 2014).
